Chapter 1: Introduction
1.1 Overview of the meat consumption, production, and trade
1.1.1 Meat consumption
The global average per capita meat consumption has increased with almost 20 kilograms since 1960, at a rate higher than the population growth. This increase in per capita meat consumption has been strongest in countries, which underwent a strong economic growth, for example China’s meat consumption has increased more than tenfold and Brazil’s nearly quadrupled. One clear exception is India where, mostly due to religious purposes, the meat consumption is close to stable even though the GDP per capita has increased. What has also become clear from the FAO meat consumption statistics is that when a country reaches a certain economic level their meat consumption levels are high but with limited changes and sometimes even slight decreases.
When then taking a closer look at the meat preference, it became clear that in 2013 the average person consumed around 16 kilograms of pork; followed by 15 kilograms of poultry; 9 kilograms of beef/buffalo meat; 2 kilograms of mutton & goat; and only a fraction of other meat types. Where China as in China pork consumption takes two-thirds of the share of its overall meat consumption. In the United States of America, beef/buffalo and poultry dominate their meat consumption. In addition, in New Zeeland there is a much higher preference for mutton and goats meat.
1.1.2 Meat production and trade
After giving an overview of the progress of meat consumptions and its evolution it is also of importance to shed light on the production of this commodity. When looking at the region meat production, Asia accounts for approximately 45 percent (mainly due to the production in China), whereas Europe and North America produce around the 19 and 15 percent, respectively. This is a big transition of where the production was in 1961. At that time Asia sat around the 12 percent, while Europe and North America where situated approximately at the 42 percent and 25 percent mark. This is not due to the fact that the European and North American production has been stagnant, both more than doubling, but because the Asian meat production has increased almost 15-fold since 1961. The biggest contributor to this staggering growth has long since been China, with approximately 92 million tons in 2018, that accounted for almost 27 percent of the world production (FAO, 2018).
............................
1.2 Objective and leading questions
The overall objective is to investigate the domestic and foreign value added in the Chinese meat sector and make policy adjustment geared to increase China's value added for the meat industry within the global value chain.
1.2.1 Specific objectives
Taking the before mentioned as basis the following are the specific objectives:
1. Analyze the current state of the meat industry worldwide.
2. Analyze the current state of the meat research in China.
3. Analyze the value added within the GVC of meat pertaining to China and its main exporters
4. Make policy changes to improve China’s value added within the GVC of meat pertaining to China and its main exporters.
1.2.2 Key research questions
To fulfil these specific objectives, the research addresses these three following questions:
1. What is the global production and trade in regards to the meat industry?
2. How to analyze the value added within the meat industry?
3. What is the meat value added within the GVC of pertaining to China and its main exporters?
4. What policy changes can be implemented to improve China’s value added within the GVC of meat?
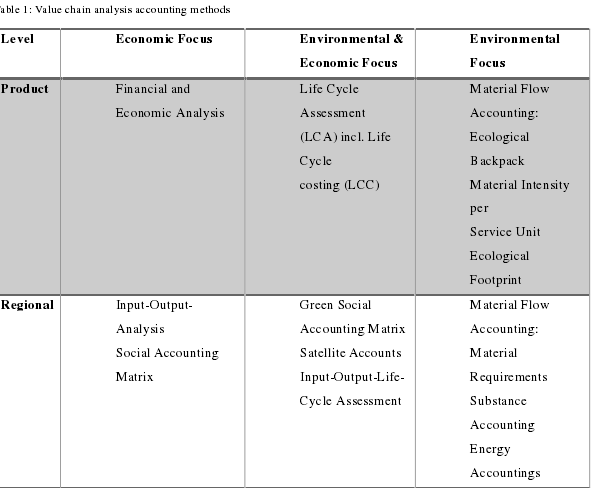
Table 1: Value chain analysis accounting methods
CHAPTER 2: Literature Review
2.1 Global value chain theory
The term value chain refers both to a set of interdependent economic activities and to a group of vertically linked economic agents, depending on the scope of the study the focus of the analysis can be on the activities or on the agents (Bellù, 2013). As time has progressed the basic theory and concepts surrounding value chains was changed as a result of different influences and research (Kim & Shin, 2002). Thus leading to an increase in international fragmentation of value chains, which entails that different companies or enterprises in the same and other countries increasingly carry out the different parts of the chain. Two of the key factors behind this move is the availability of resources (inputs) and reductions in transaction costs.
The reduction in transaction cost refers to better integration in the market or better vertical integration. This globalization of the value chains has led to an increase in trade on inputs, intermediate goods, and final products (World Bank, 2017). The basic principles of value chain analysis, where the main focus was on allocation of value chain activities, has enjoyed increasing interest because of the fast development of the reallocation different aspects of the value chain. In addition to the “standard” value chain, the integration of environmental factors in value chain analysis has also increased. This finds its basis in the fact that value chains use environmental resources for its economic activities and in agricultural production. Thus it can be stated that the environment provides basis for all essential inputs and energy as well the capacity to dispose emissions and waste (Fabe, Grote, & Winter, 2009). This has then resulted in more focus on the public interest, increased consumer perception, and environmental impact of products impacting environmental policy programs (Boons, 2002).
The concept of value chains is now not only based in the field of economics but has diverged into a multi-disciplinary topic, thus resulting in many methods for analyzing value chains. These methods can be divided in two main categories: the first being a more descriptive and qualitative emphasis (Kaplinsky & Morris, 2000), and the second focusses on specialized analytical tools, referring to modeling and simulations of supply chains (Ondersteijn, Wijnands, Huirne, & Van Kooten, 2006; Thun, 2005).
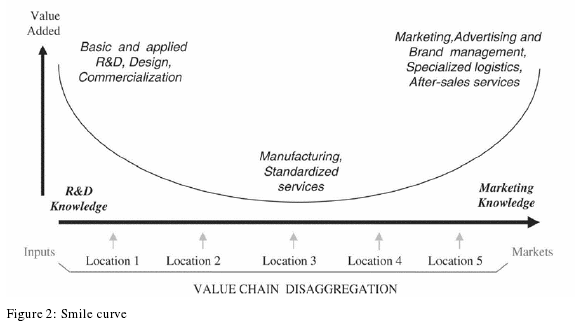
Figure 2: Smile curve
........................
2.2 Mapping the (Global) Value Chain
In analyzing the GVC, the first step is understanding how it’s connected. This refers to the mapping of the GVC. At the core it is to identify the actors and then to map the product flows within the chain including input supply, production, processing, and marketing activities (De Backer & Miroudot, 2012). This giving a representation of the identified actors and the related product flows. A mapped value chain includes the actors, their relationships, and economic activities at each stage with the related physical and monetary flows (Todeva & Rakhmatullin, 2016). As described in (Fabe et al., 2009), there are two different kinds of approaches used for mapping. The “Functional and Institutional Analysis” and the “Social Network Analysis”.
2.2.1 Functional and Institutional Analysis
The FAO provides a set of modules, which presents a systematic approach to value chain analysis for agricultural commodities (Fabe et al., 2009). The mapping is denoted as a functional and institutional analysis (Bellù, 2013; Bockel & Tallec, 2006) which starts with constructing a ‘preliminary map’ of a particular chain to provide an overview of all chain stakeholders (institutional analysis) and the type of interaction between them (functional analysis). The results can be presented either in a table or in a flow chart. The FAO methodology includes three essential aspects for developing a preliminary map (FAO 2005a):
1. The principal functions of each stage;
2. The stakeholders carrying out these functions;
3. The principal products in the chain and their various forms into which they are transformed along the entire chain.
Once the flow chart has been drawn, these flows are quantified, both in physical and monetary terms. The procedure allows assessing the relative importance of the different stages or segments of the chain. Kaplinsky and Morris (Kaplinsky et al., 2003) suggest similar procedures for implementing value chain analysis. Their concept consists of two steps in order to map the value chain of interest. The first step includes drawing an ‘initial map’, which shows the chain boundaries including the main actors, activities, connections and some initial indicators of size and importance. The second step consists of elaborating the refined map by quantifying key variables such as value-added, and by identifying strategic and non-strategic activities. This refined map can be understood as a framework for showing chain statistics (McCormick & Schmitz, 2001).
.................................
Chapter 3 Methodology: Analytical framework and Models .............................. 24
3.1 Methodology ...................................... 24
3.1.1 GTAP model and database ..................................... 24
3.1.2 GTAP_VA Model .................................... 25
Chapter 4: Results and Discussion ................................................... 32
4.1 Baseline simulation results .................................... 32
4.1.1 The bilateral exports’ domestic and foreign value added content .................................. 32
4.1.2 The direct or indirect domestic value added ................................ 34
Chapter 5: Conclusion ........................... 48
Chapter 4: Results and Discussion
4.1 Baseline simulation results
The following will shed light on the state of the value added of the regions that are the main exporters of meat to China, as described in chapter 3.2.1 The data and aggregations.
4.1.1 The bilateral exports’ domestic and foreign value added content
When analyzing the DVA, DDC, and FVA of Spain, Brazil, the USA, Australia, and Argentina when exporting to China the following was found for:
Spain: had a total value added of $14,698 million, whereas $11,259 million originates in Spain and $3,427 is foreign based (DVA 77%, FVA 23%). The double-counting (DDC) was negligible at 0.09%. Its biggest contributor is the Transportation and communications sector at 28% of the total VA. The meat sector (cmo), only added 3.2% ($471 million) to the total VA, with the DVA, DDC, and FVA respectively taking 78.8%, 0.1%, and 21.2% as seen in Figure 12: Spain’s VA exported to China (VADECOMP).
Brazil: $43,935 million out of $49,085 million of the total VA, accounted for the DVA. It follows that $5,133 million is the foreign value added provided by other countries. The double-counting component – i.e., the value of Brazil’s exports that had already been exported, imported again, processed, and finally embedded in its exports to the China - amounts to $17 million (0.04%). The biggest sector adding to the total value added was the Extraction sector at 38%. The meat sector accounted for 5.18% of the TVA (total value added), with 93.5% DVA, 0.0% DDC, and 6.5% FVA. Illustrated in Figure 13: Brazil's VA exported to China (VADECOMP)
...............................
Chapter 5: Conclusio
China is the largest producer of meat in the world, but it has also been holding the first-place position in the import of meat, with approximately 9% of the global import value. However, in 2019 and 2020 there was a respective rise in meat imports of almost 71% and 175% compared to 2018. On the other hand, top five exporters to China have been Brazil, Spain, United States of America, Argentina, and Australia. Due to the rise in demand, the export value of meat has seen a yearly increase averaging around the 6% from 2016. With the top ten exporters accounting for a little over 65% of the world exports, and the United States of America leading the pack with approximately 13%, closely followed by Brazil (11%), where after Australia came in at third with 8%.
The reason for the increase in China's imports of meat may be due to the high domestic demand for these goods, households going from lower to middle-income, meat goes from a luxury item to a “basic necessity”, or other conditions such as a decrease in production, if any, due to diseases or other reasons. For the basis of this research the consumption was further emphasized upon. China’s consumption has increased more than tenfold since 1961.To keep up with the local demand, China has then also grown to be the biggest producer of meat. Even having reached those high production levels, it is still the biggest importer of meat. The question that then arose was what the level of the domestic and foreign value added is within the value of the imported meat.
Thus, the purpose and overall objective of this research is to investigate the domestic and foreign value added in the Chinese meat sector and make policy adjustment geared to increase China's value added for the meat industry within the global value chain. Taking the before mentioned as basis, the following are the specific objectives: A) Analyze the current state of the meat industry worldwide, B) Analyze the current state of the meat research in China. C) Analyze the value added within the GVC of meat pertaining to China and its main exporters, and D) Make policy changes to improve China’s value added within the GVC of meat pertaining to China and its main exporters. In addition to fulfilling these specific objectives, the research addresses these three following questions: “What is the global production and trade in regard to the meat industry?”, “How to analyze the value added within the meat industry?”, and “What is the meat value added within the GVC of pertaining to China and its main exporters?”
reference(omitted)